Wednesday, 31 July 2024

My experience with the WatsonX Hackathon 2024


Recently I had a chance to lead a team at the IBM WatsonX Hackathon and I must say it was a great experience. My team chose track 2 and we built a total of 8 intelligent assistants using prompt engineering techniques. 

The use case was about increasing profitability for a fictitious retail client that we customized to match a real client scenario. 


Here are the brief steps we took.

1. Customized the case study to match a real client (without using client confidential or sensitive data)

2. Extracted the client pain points

3. Mapped the pain points to KPIs to better monitor and manage them

4. Identified intelligent assistants that could be created

5. Created and tested those assistants

6. Identified ROI with respect to improvement in cost and time savings vis. a vis. manual effort


As a final step we created a stand up pitch to showcase what we had done.

While I do not expect to win anything as there were thousands of great solutions submitted by IBMers around the globe, the whole experience led to a lot of learning and confidence building.

As employees, we got first hand experience working with LLMs.


Thursday, 14 March 2024

Tips to pass the Microsoft DP600 exam - Implementing Analytics Solutions Using Microsoft Fabric


Last weekend, I took the beta version of the DP600 exam. Today, the results were released, and I am happy to report that I passed. The DP600 exam is an associate-level certification. exam that tests the candidates in the areas below:

  • Lakehouses
  • Data warehouses
  • Notebooks
  • Dataflows
  • Data pipelines
  • Semantic models
  • Reports


This exam is set to replace the DP-500 exam, whenever it retires!

As I had noted in an earlier blogpost, that, Microsoft Fabric attempts to get everything under one roof and package it as a SAAS solution.

Anyway, the reason for this post is to outline some tips and tricks so that you can make the most of this exam, now that it is out of beta! 

I would not reveal much details about the questions, to ensure I do not break the Microsoft no-disclosure agreement (NDA).

Exam format:

Skills measured

  • Plan, implement, and manage a solution for data analytics (10–15%)
  • Prepare and serve data (40–45%)
  • Implement and manage semantic models (20–25%)
  • Explore and analyze data (20–25%)


  • Around 40-60 questions including one or more case studies, drag and drop, fill up the blanks, type in and multiple choice. Details regarding Microsoft exam format can be found here.
  • Case studies will require complex decision-making.
  • The exam expects you to have coding knowledge in SQL, DAX, PySpark, Scala, Power Query. 

Preparation tips:

  • Go ahead and schedule the exam first. Don't wait till you complete preparation. With a hard deadline in front of you, you will be bound to spend time learning. I have seen people who keep preparing and preparing and keep delaying their exams. It doesn't help. Microsoft allows you to reschedule exam too. I have done that in the past. So, don't worry.
  • Ensure you have enough hands-on done while preparing.
  • I completed all the MS learn modules related to the exam as part of instructor-led training as well as the self-paced ones. Absolutely essential to have a trial Fabric subscription.
  • I went through the practice assessments multiple times. For questions where I failed to give the correct answer, I went through the reference materials to understand the concepts.
  • Apart from the entire MS Learn path that one needs to complete, I went over the syllabus and did my own curation of links. Sharing them here. Some of the links may be repeated, so feel free to ignore repetitions.
  • I found the exam cram sessions very helpful too!
  • Don't look for dumps. First of all, it is against Microsoft policy, and second of all, even if you pass with dumps, you will gain no knowledge necessary to implement analytics solutions with Microsoft Fabric. That is the end goal, not just adding a fancy credential to our resume!


Microsoft Fabric licensing

https://learn.microsoft.com/fabric/enterprise/licenses#microsoft-fabric-license-types

Exam tips:

  • This is a time-bound exam. So effective time management is crucial. You do not want to end up not being able to answer all questions. Case studies are timed separately but still part of the overall time that the exam allows, so ensure you keep time for case studies. I submitted my exam one minute before the final bell.
  • You need to get at least 700 out of 1000 to pass! And there is no negative marking, so attempt all you can!
  • Don't spend too much time on a single question. If you are not sure, guess an answer and mark it for review later, so you can come back and have a re-look.
  • The exam allows opening MS Learn, use it judiciously. If you search MS Learn for every question, you will run out of time without answering all. I suggest using MS Learn only for the questions that you marked for review!
  • I took my exam from the Pearson exam center. I suggest the same. There will be an invigilator who will proctor the exam and you will need to show your pockets and leave all your belongings in the locker. I had two other guys sitting next to me giving their own exams (not DP600), but I did not face any disturbance or problems due to them. If you take the exam from a Pearson center then you are also insured in case there are infrastructure or network-related issues. If the same happens from your home, the voucher / your money could be wasted.
In conclusion, DP600 is a tough exam. Don't take it lightly - right from the way you prepare to giving your ultimate best during the exam. In terms of difficulty, I would place it somewhere between Azure Data Engineer Associate and Azure Solutions Architect Expert, which I have earned in the past. Study all you can. Practice all you can. Don't rely solely on one source of training/learning.

I wish you all the best. If any of the links do not work out, let me know in the comments and I'll correct them. Would love to know your experiences too, with this brand new exam!


Thursday, 7 March 2024

Power BI report sample - GIT integration

 I had not been in touch with Power BI too much with most focus on Azure. But recently I decided to explore what had changed during the time I lost touch. The Power BI community is vibrant and keeps adding new features every month and for sure so much has changed!

The feature I liked the most was git integration. I decided to try it out with a report I had created from Wikipedia data - an animated visual for automotive trends in Japan.

Here is a snapshot of the report.


I wanted to see how I could achieve git integration and so, I opened the .pbix file and did the following.

This is still a preview feature, so from Power BI Desktop > File > Options and settings > Options > Preview features, I selected the checkbox for the Power BI Project (.pbip) save option.


I clicked ok and saved the report as a .pbip file instead of the .pbix.
The moment I do that, I notice the following files created in the designated folder location -


Notice the .gitignore file!

Next, I use the "open with" menu option to open the folder with VS Code, like below.


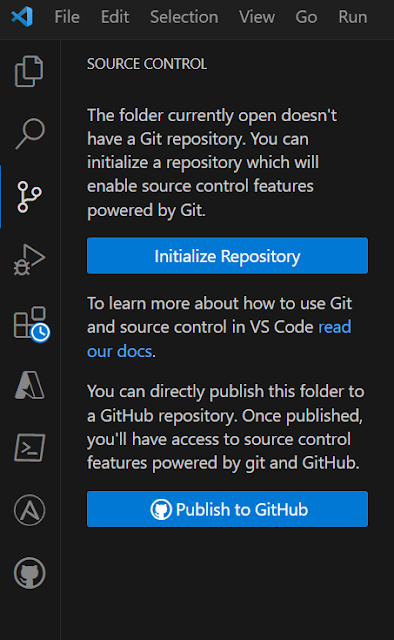
Then after this is open I VS Code, I initialize a new repo.


This shows me all these files now!


Once I had reviewed the files, I synched the changes to my remote Github repository.


On my remote branch!


I also enabled VS Code to periodically run "git fetch".
Now, let me see how changes to the local PBIX file get tracked and how I can synch any changes to my remote git branch!

I make a very simple change, adding a "The" to the report title!


And immediately in my open VS Code editor, I see that the changes have been tracked!


Details below:

I can see side-by-side the exact change I made to the title!


No surprises for me, so I go ahead, stage, and commit the changes to synch with the remote git branch!

And sure enough, I can see the changes in remote as well.


So, all in all, a fantastic feature that I am sure most of you would like!


Wednesday, 28 February 2024

Fabric - Data ingestion and transformation use-case

Recently I started learning about Microsoft Fabric. Thanks to my employer for providing the opportunity via a great self-paced learning path as well as instructor-led training. 

So, how is Fabric different from other similar offerings from Microsoft?

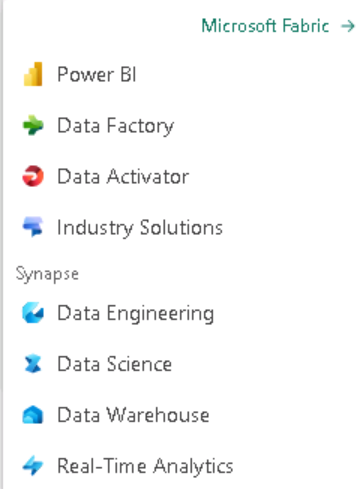
In a nutshell, Fabric strives to bring everything together under one roof. What does everything consist of?
Take a look.


So right from data ingestion to refinement to analytics to advanced data science, everything is possible to be done with this SAAS (Solution As A Service) solution from Microsoft. 

Let's try to read data from an online data source and write it to the lakehouse.

So, first of all, I created a new workspace with fabric capacity enabled. 

Then I go to the Synapse > Data Engineering 

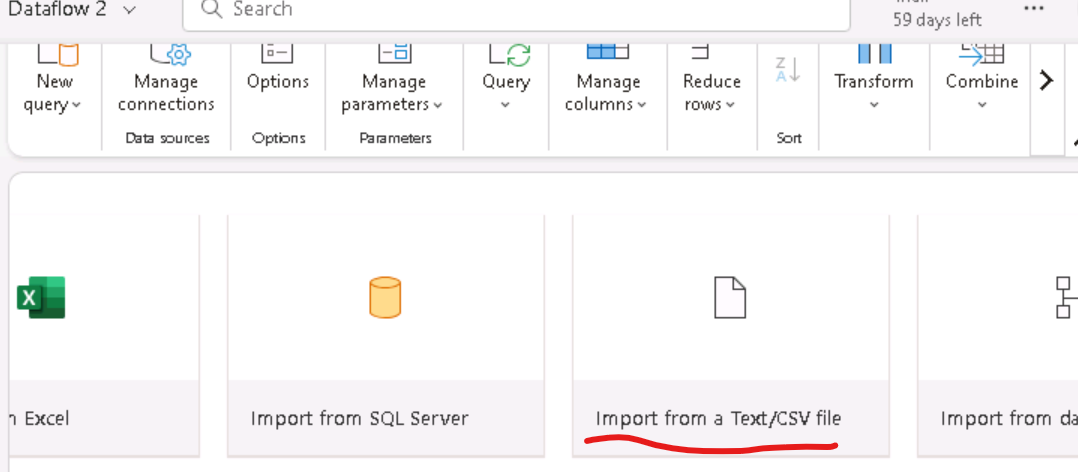
Here I click on New > Data Flow (Gen 2)


Next, I select "Import from text/CSV" when the interface comes up.


I connect to the data source by providing the URL where the data resides.


In terms of credentials, here for this demo use case, I used anonymous credentials for the publicly available data source.

Once done, it takes a moment and then you can preview the data like this.


I am satisfied with the preview, so now I click on "Create".

Immediately as a next step, I can see a familiar Power Query interface! So, what used to happen in silos, is now under one roof. You ingest data and then immediately start working on transformation with Power Query, all within the same interface!


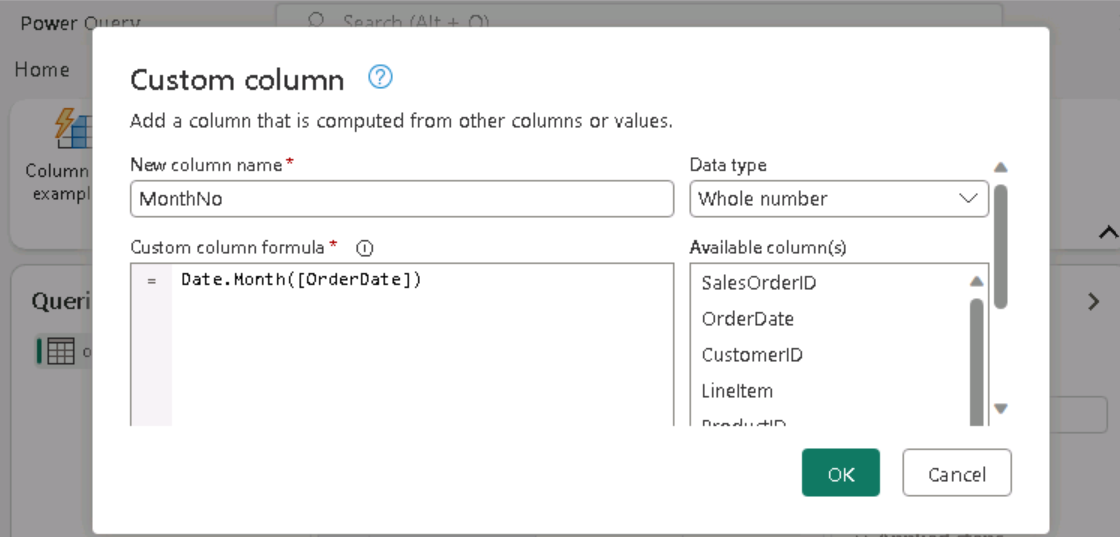
I decide to add a custom column to the dataset from the "Add column" tab menu.


And it immediately shows up like below:


Next, I add a destination - the lakehouse which will house this ingested and transformed data:


I added lakehouse as the destination. I had one created beforehand, which I selected.


The diagram view showed the flow nicely. The small icon on right corner represents that the destination is a lakehouse.


So, to recap, I had a lakehouse created beforehand to serve as the destination for the online csv data. I created a data flow gen2 to ingest as well as transform the data. But I cannot run a dataflow as is. I can however run it as part of a data pipeline, which is what I will create next!

So, in similar way like before, I go to the workspace and create a pipeline from new -> Data pipeline menu option.

In the pipeline editor that opens, I select "Add pipeline activity".


And then I added the dataflow I had created before, as a child.


Next, I save the pipeline and hit the RUN button.

The monitor shows the underlying dataflow activity running which will essentially ingest as well as transform the data adding one custom column.


And then it succeeds.


The interface allows me to see the input and output from the run activity.


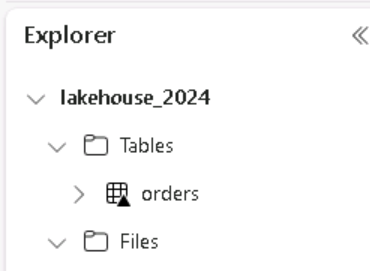
From explorer in Lakehouse, I can see that the table is already created.


The small triangular mark on the table represents that it is a delta table.
If I right-click on the table and view files, it shows the underlying parquet files, which is how the delta table data is originally stored!


Note that, the lakehouse has a couple of endpoints -
1. Semantic model
2. SQL analytics endpoint.


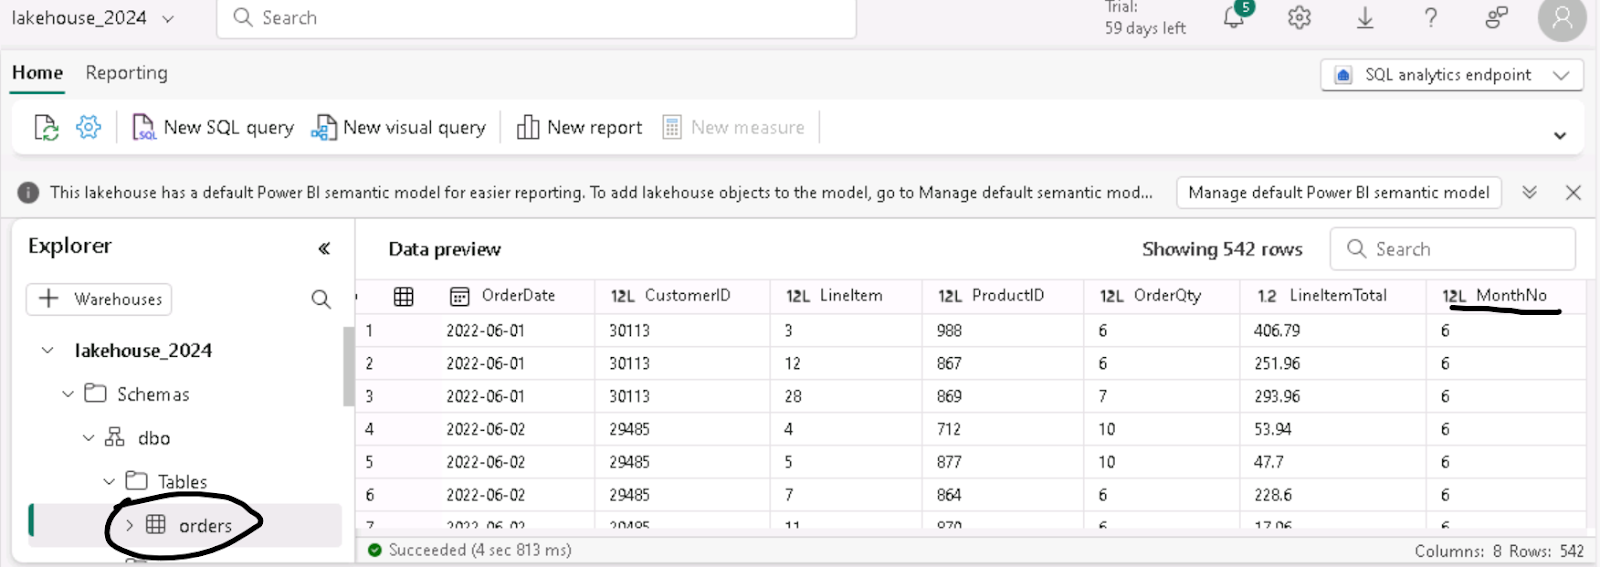
I wish to check out the newly created table now, so I now use the SQL analytics endpoint.
I can see the table as well as the data preview shows the new custom column we had added in one of the previous steps.


So, we successfully ingested a CSV file from an online source using a dataflow and a pipeline inside the lakehouse!

Friday, 19 April 2019

The Azure Advisor

This afternoon when I logged into my Azure personal subscription and was presented with the screen below.


There was no set-up I had done and this was totally impromptu. So, I decided to dig a little deeper.

The azure advisor was launched earlier this year with the objective of providing proactive recommendations that would allow a user to improve performance, security and high availability of resources.

So, once I got the pop-up I decided to look a little closer and check out what is do-able from such a proactive notification.

Note: You need to have at least one active subscription to be able to view advisor recommendations.

And if you have it, once you click on "View my active recommendations", a screen like the below will show up. Note: The above and below images are not identical, as I used two different subscriptions for this article.


So, I decided to check out the Security related recommendations and sure enough, there were quite a few out there. Below is a sample of what you might see.


The best part was right below, I had detailed recommendations on what Microsoft suggests to be the best ways to secure the environment. Each recommendation came with a "secure score impact" which meant implementing it would add that score and help a resource turn green from red. By default, the whole set of recommendations are sorted by score in descending order and each recommendation also has the failed resources tagged to it.

A sample provided below for reference.


This was not all. Clicking on a recommendation gives details on threats of not implementing it as well as remediation steps, making the task really simple for an Azure administrator.

A sample below for reference.


So, overall, we have a way for automated health check of the Azure environment and the best part is - the recommendations are really detailed at resource level and it is easy to follow.

What do you need though?
1. An Azure subscription with the owner, contributor or reader access
2. As of this date, recommendations are provided for virtual machines, availability sets, application gateways, App Services, SQL servers, and Azure Cache for Redis.

Know more about this on the official Microsoft link.