
So, how is Fabric different from other similar offerings from Microsoft?
In a nutshell, Fabric strives to bring everything together under one roof. What does everything consist of?
Take a look.
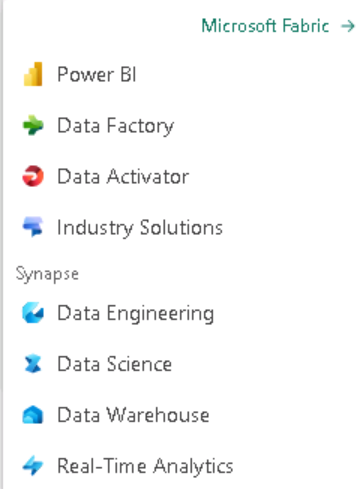
So right from data ingestion to refinement to analytics to advanced data science, everything is possible to be done with this SAAS (Solution As A Service) solution from Microsoft.
Let's try to read data from an online data source and write it to the lakehouse.
So, first of all, I created a new workspace with fabric capacity enabled.
Then I go to the Synapse > Data Engineering
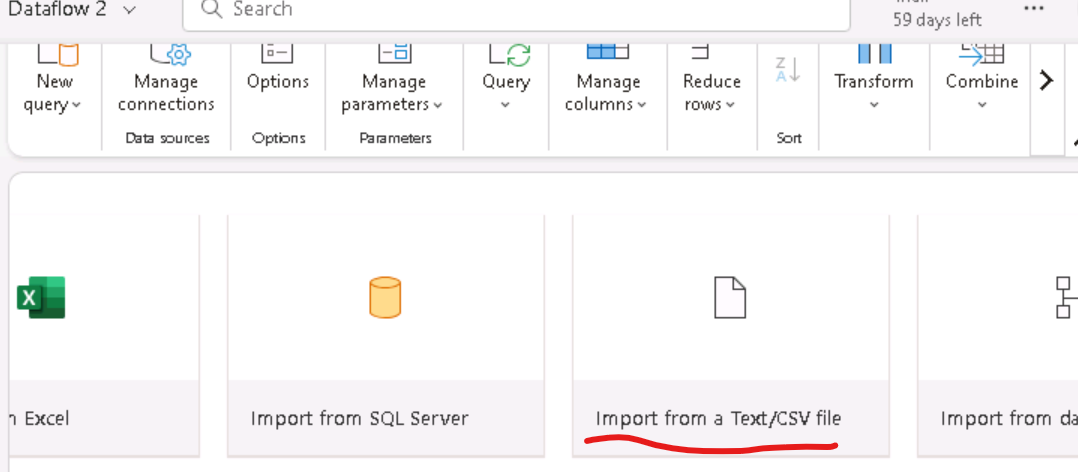
Here I click on New > Data Flow (Gen 2)

Next, I select "Import from text/CSV" when the interface comes up.
I connect to the data source by providing the URL where the data resides.

In terms of credentials, here for this demo use case, I used anonymous credentials for the publicly available data source.
Once done, it takes a moment and then you can preview the data like this.

I am satisfied with the preview, so now I click on "Create".
Immediately as a next step, I can see a familiar Power Query interface! So, what used to happen in silos, is now under one roof. You ingest data and then immediately start working on transformation with Power Query, all within the same interface!

I decide to add a custom column to the dataset from the "Add column" tab menu.
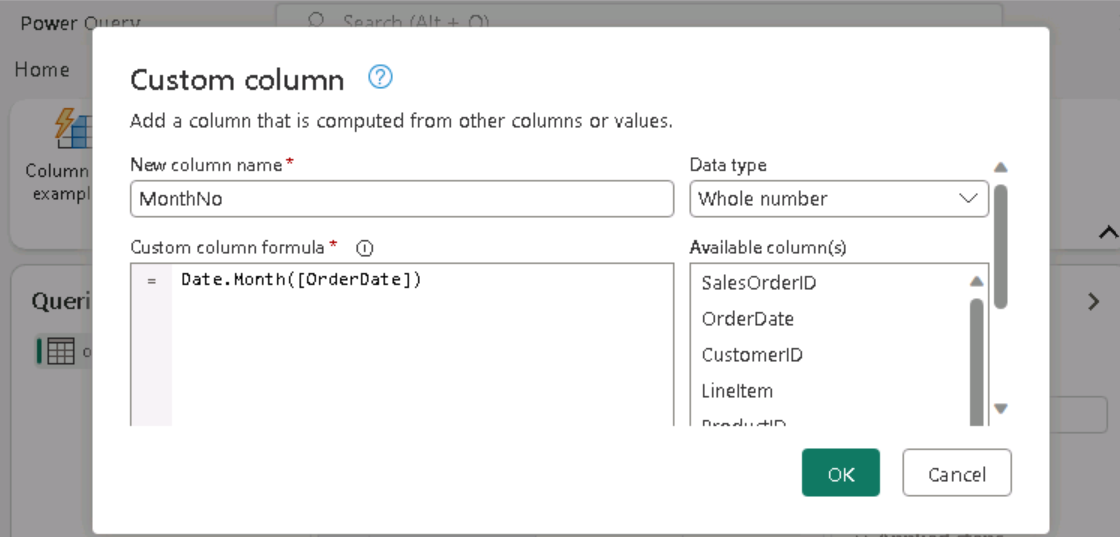
And it immediately shows up like below:

Next, I add a destination - the lakehouse which will house this ingested and transformed data:

I added lakehouse as the destination. I had one created beforehand, which I selected.

The diagram view showed the flow nicely. The small icon on right corner represents that the destination is a lakehouse.

So, to recap, I had a lakehouse created beforehand to serve as the destination for the online csv data. I created a data flow gen2 to ingest as well as transform the data. But I cannot run a dataflow as is. I can however run it as part of a data pipeline, which is what I will create next!
So, in similar way like before, I go to the workspace and create a pipeline from new -> Data pipeline menu option.
In the pipeline editor that opens, I select "Add pipeline activity".

And then I added the dataflow I had created before, as a child.

Next, I save the pipeline and hit the RUN button.
The monitor shows the underlying dataflow activity running which will essentially ingest as well as transform the data adding one custom column.
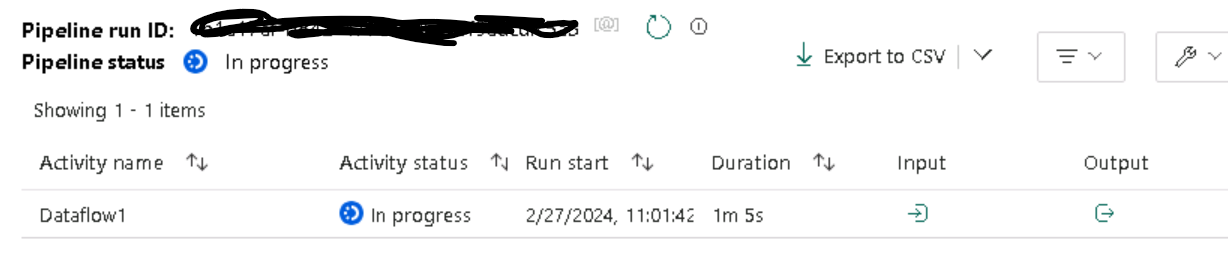
And then it succeeds.

The interface allows me to see the input and output from the run activity.


From explorer in Lakehouse, I can see that the table is already created.
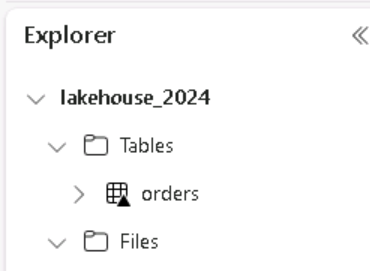
The small triangular mark on the table represents that it is a delta table.
If I right-click on the table and view files, it shows the underlying parquet files, which is how the delta table data is originally stored!

Note that, the lakehouse has a couple of endpoints -
1. Semantic model
2. SQL analytics endpoint.

I wish to check out the newly created table now, so I now use the SQL analytics endpoint.
I can see the table as well as the data preview shows the new custom column we had added in one of the previous steps.
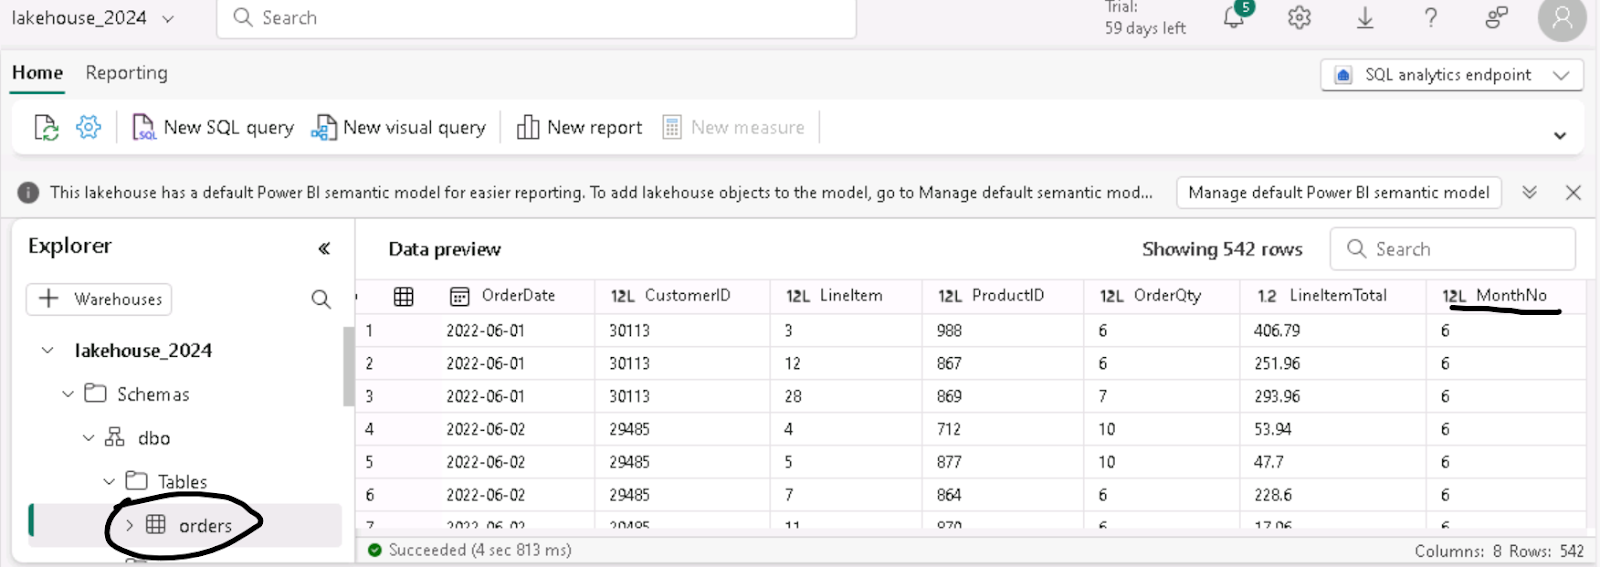
So, we successfully ingested a CSV file from an online source using a dataflow and a pipeline inside the lakehouse!
No comments:
Post a Comment